[This is the final blog post on BizLab Fellow Wendi Ding’s project, the Persona Experiment.]
To evaluate our donation personas, we ran ads on Facebook for three days pointing to our persona donation experiment. As outlined in our previous blog post, we wanted to determine two things with the experiment: if the personas reflect unique populations in our listener audience and, if we communicated to in the language and perspective of their personas, if listeners will engage more with us. From these ads, we had 406 participants in the experiment. Below is a summary of our discoveries and observations.
Finding: Overlapping Personas
Based on how these users selected amongst the three personas, we can say that these three personas exist, but they are not significantly distinct from each other. 53% of users clicked “All of the above,” indicating that our personas overlap for a significant portion of the audience.
 |
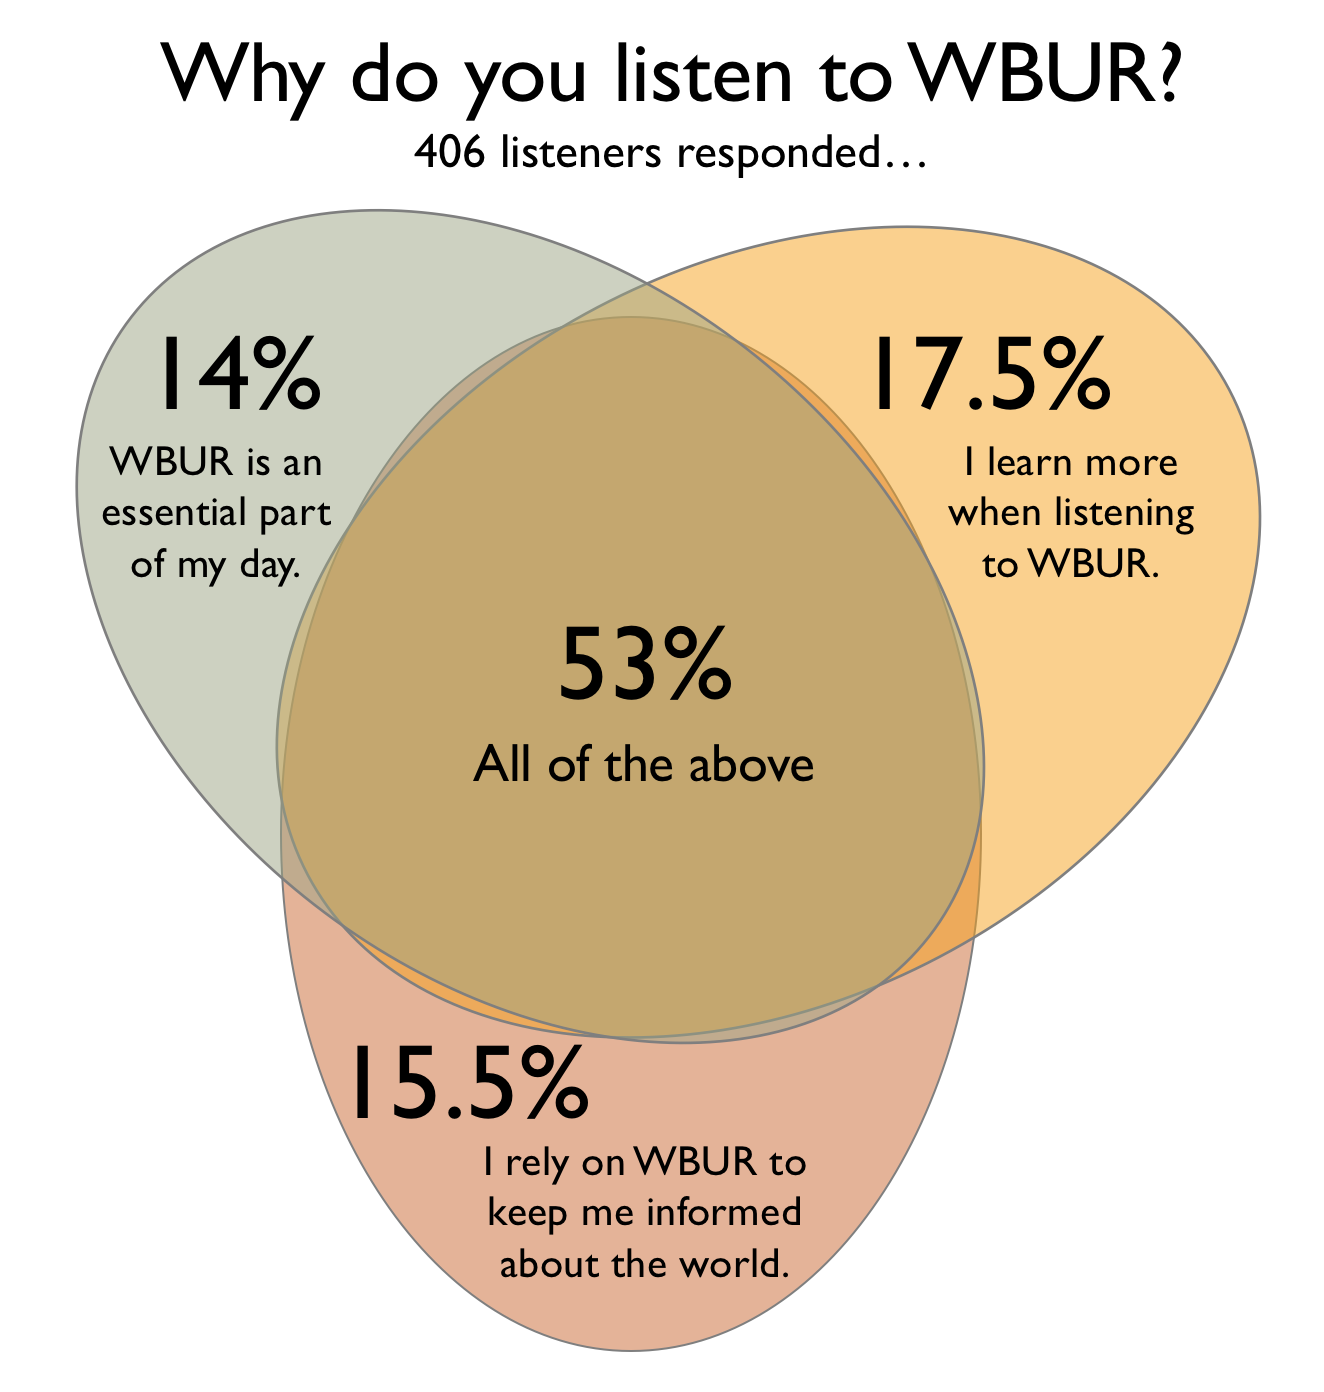 |
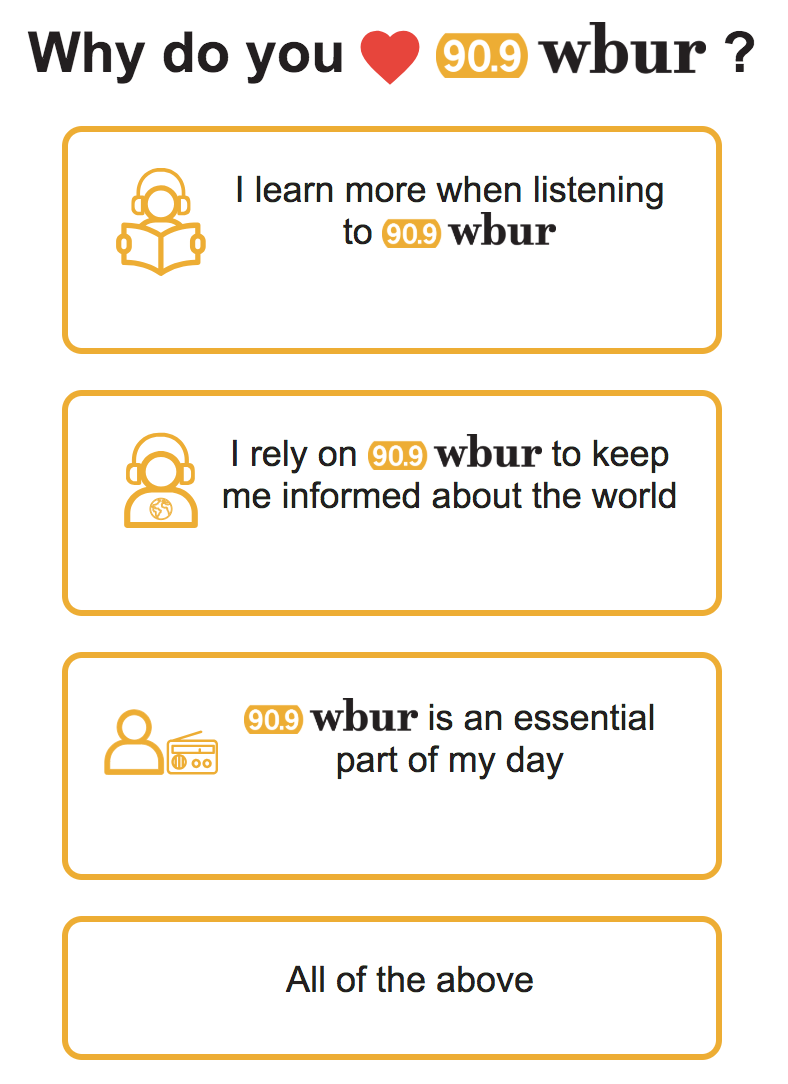
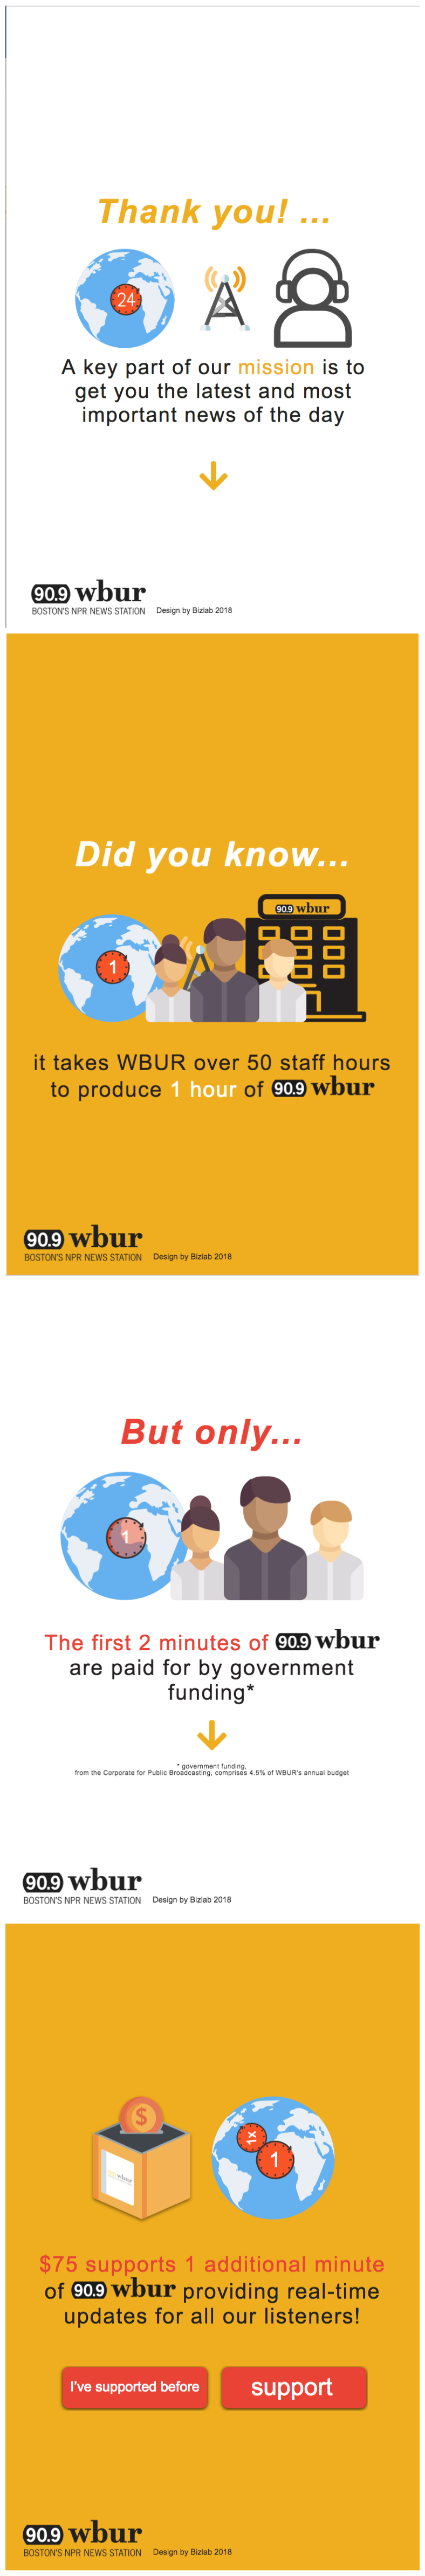
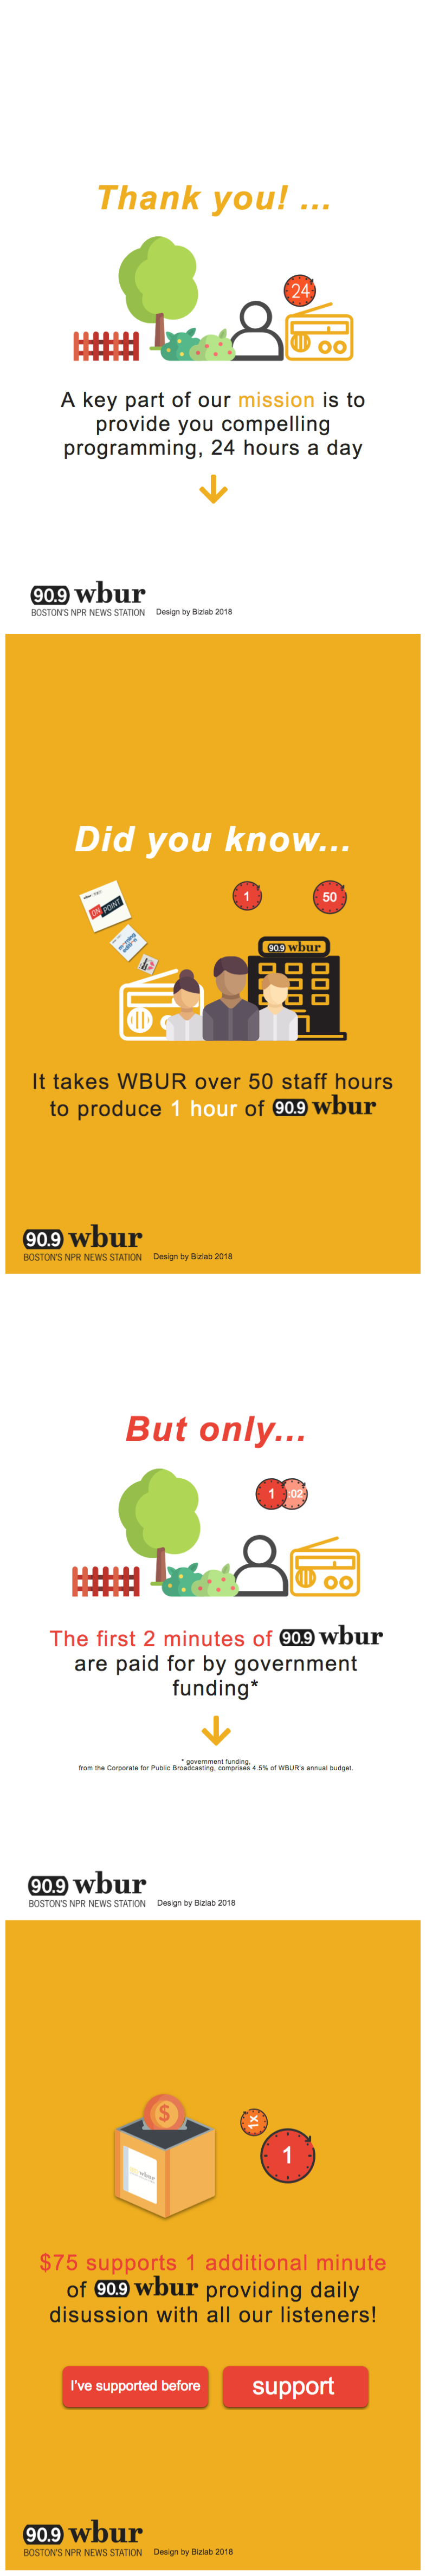
- 17.5% chose “I learn more when listening to WBUR.”
- 15.5% chose “I rely on WBUR to keep me informed about the world.”
- 14% chose “WBUR is an essential part of my day.”
- And 53% chose “All of the above.”
While half our audience agreed with all statements, we have evidence now that a message focused on just one of these themes will not resonate with about 30% of listeners. This is a useful metric to keep in mind when crafting donation messaging — not all messages works for all listeners.
Observation: Significant Drop Off Through the Funnel
As anyone in digital marketing or web analytics knows, users bounce and drop off through any user experience. This experiment is no different. So we saw users drop off between clicking on a persona button and landing on the next page of the experience, and then throughout the scroll of the messaging page. This chart illustrates the drop off and highlights a lesson we should have known: we need more than 406 users to enter the funnel if we want to receive donations at the end.
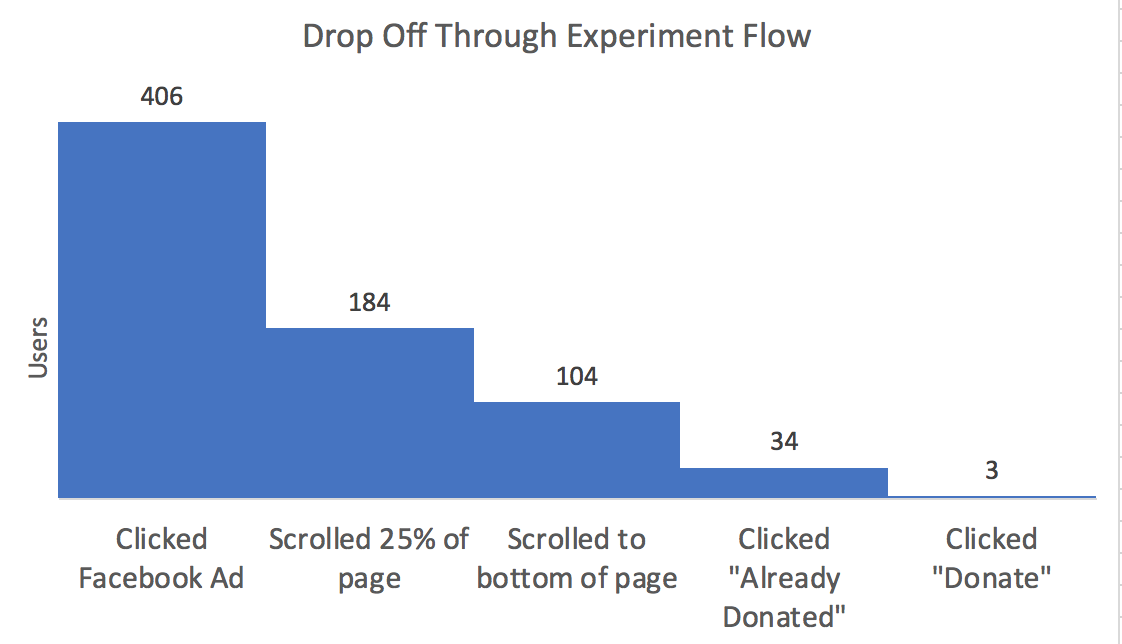
At the end of our experiment, no one donated. Three people clicked on the “support” button (2.9% of the 104 users who scrolled to see the button, 0.7% of our original pool of users). So, in terms of our ambitious goal of showing that targeted messaging leads to more donations, we cannot prove, or disprove it, because we didn’t have donation data to analyze.
Observation: Scrolling through Persona Messages
When users clicked on persona, they entered a scrolling page of messaging, either aligned to their persona or not. Overall, 56% of users who landed on the page to read the message scrolled to the bottom of the page, irregardless of the messaging. There is some variation in which messages generated the most scrolling, as shown in the table below, but the numbers within each category are too small to draw definitive conclusions.
| Users scrolling to bottom of page when… | Aspirational Learner | World Citizen | Lifelong Listener |
|---|---|---|---|
| Message aligned to their persona | 55% | 62% | 54% |
| Message mis-aligned to their persona | 55% | 60% | 20% |
Users who selected “All of the above” were randomly assigned to the different persona messages. The percentage of users scrolling to the bottom of the page may indicate that our Lifelong Learner message and imagery worked better: 67% people who saw the Lifelong Listener message scrolled to the bottom of the page, which is the best performance among the three. But overall, this indicates that the messages worked equally well at engaging a user in scrolling through.
| Message seen by an “All of the above” user |
Percentage reaching bottom of message |
|---|---|
| Aspirational Learner message | 56.8% |
| World Citizen message | 52.6% |
| Lifelong Listener message | 66.7% |
Our take-away from this scroll data is that crafting uniquely persuasive, persona-based messaging is hard and we didn’t nail it on our first try. Or perhaps the UX research is right: people don’t read and it was random who scrolled to the bottom.
Finding: Our Donors are Engaged
Of the 104 people who reached the bottom of the page with the call-to-action buttons, 3 people clicked “support” and 34 people clicked “I’ve supported before.” 67 people did not click a button.
We conclude from this that at least 33% of experiment participants were donors. This rate is approximately double the rate of listeners who are donors (which is approximately 15%). As we are finding in all of our experiments in BizLab, our existing donors are connected to us, willing to try out our pilots, and looking to engage with us. As one of our goals is to engage non-donors in new ways, such as through buying merchandise or looking for books, we have our work cut out for us. Stay tuned as BizLab’s Fall/Winter 2018 experiments get underway…