[This is part 3 of a series of blog posts for WBUR BizLab’s Affiliate Marketing Project, funded by the Lenfest Institute.]
As we approached the Affiliate Marketing project, we established key performance indicators (KPIs) to measure while testing, and to guide the refinement of our strategy. Both of our KPIs are based on product clicks from our product guides on WBUR Guides to retailer websites. Once users leave our site we can’t track which of them convert to purchase, so product clicks are the limit of our ability to track users from acquisition through to conversion.
Our most important KPI for evaluating each promotional campaign is Product Click Rate. This allows us to judge varying audiences by indicating their relative likelihood to click one of our products.
Product Click Rate = Quantity of Product Clicks / Quantity of Users
When comparing paid campaigns, the most important KPI is Cost-per-Product-Click. This makes it easy to understand which of your paid campaigns is arriving at your desired end-result most cost-effectively.
Cost Per Product Click = $ Cost of Campaign / Quantity of Product Clicks
Traffic to Guides and Earnings from Amazon and CJ Affiliates
Between site launch on May 23, 2019 and the close of the project July 31, 2019, more than 39,000 users visited our site in over 42,000 sessions.
- That activity yielded $203.01 in referral earnings from 111 purchases. (I’ll spare you the grisly details, but $203 is far less than we invested in Facebook ads.)
- 77% of user purchases came from Amazon, and the rest from individual retailers registered with CJ Affiliates.
- Overall, we received a 7.01% commission from our referred Amazon sales, and a 12.76% commission from CJ Affiliates.
- 72% of our Amazon sales were for indirect purchases – i.e. users clicked one of our links, then bought something else entirely.
Lesson: Begin with Amazon, then use CJ Affiliates
Our advice is to start out with Amazon and test a variety of product reviews your audience may appreciate. Measure their ROI with analytics, and monitor the products for which you’ve earned referral revenue. When you’ve found a niche, use CJ Affiliates to connect with advertisers who may be paying higher commissions than Amazon. Our reasoning is:
- Amazon offers a greater variety of products which you can advertise, and you’ll earn revenue for any Amazon purchase made by your referred audience in the 24 hours after they clicked your referral link. That’s powerful when you consider that Amazon was responsible for 33.7% of the eCommerce market in 2018.
- CJ Affiliates pays a higher commission but does not offer the above described advantage of cross-purchases. Choosing the right niche will result in higher earnings from CJ, but reviewing unpopular niche products could lead to no revenue at all.
Most Successful Guide & Product
We published a total of 11 guides, covering 10 categories including sustainable home goods, women’s shoes, travel goods, fresh vegetable delivery, and reusable straws.
Our audience was receptive – of the 120 users who answered our embedded survey, 87% said WBUR Guides are “useful,” and 82% want to see more Guides.
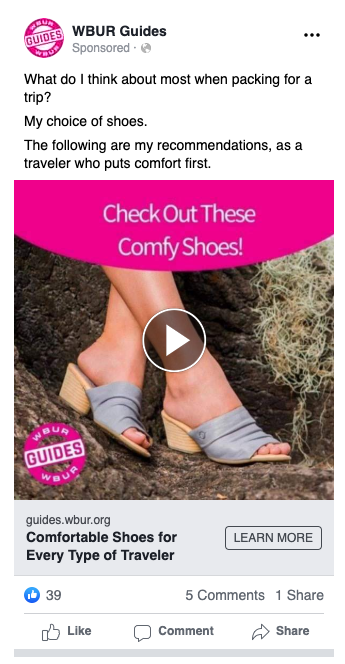
Our guide to women’s shoes, The Six Most Comfortable Shoes for Every Type of Traveler, proved to be the most popular:
- We ran a Facebook ad sending users to our homepage where we list all our published articles and 71% of those who clicked on an article chose to visit the guide to women’s shoes, despite its position as ten out of eleven in the list.
- Our first run of Facebook ads tested fresh vegetable delivery, eyeglasses, women’s shoes, and children’s toys against each other, to determine which of our ads had the greatest appeal. Users who saw the ad for Women’s Shoes clicked through at a 2.04% rate, more than twice the click-through-rate of any other ad in the test.
The above described ad series yielded three shoe purchases; no other guide produced such immediate and consistent results. In particular, one shoe, the Born Lemhi, produced more click-throughs and revenue than any other single product we advertised. Testing the image of that pair against our other featured women’s shoes in a series of Facebook ads, it yielded an ad click-through-rate four times greater than the other shoe options.
Lesson: Publish and Test a Variety of Content
Publish a variety of content and test it head-to-head using A/B testing. Find your niche by understanding which products attract an audience and then generate click-throughs and purchases. Before testing, we thought fresh vegetables and toys would perform better than women’s shoes!
Lesson: Track Everything
Before you begin to promote your content, be sure that you are prepared to track your audience’s response. You’ll need:
- Google Analytics: Install this on your site to track your site’s overall usage and analyze your audience.
- Google Tag Manager: Connect GTM to Google Analytics to track important actions such as product clicks as goals in Google Analytics.
- Google URL Builder: Every time you distribute a link to your content as part of a campaign, use this tool to set up UTM parameters, including a unique campaign name for each link. When users click those links and arrive at your site, the parameters you added allow Google Analytics to attribute that traffic to your specified campaign.
When these tools are used together, you’ll be able to attribute each user and each product click to a campaign. That way, when you strike gold and a torrent of product clicks register, you’ll be able to understand which campaign sent those users and either repeat or refine your technique.
Advertising platforms like Facebook can tell you what it cost to acquire the users, but not whether those users converted to product clicks. When using these analytics tools to connect the cost of the campaign to the end result of product-clicks, you’ll get a clearer sense of ROI.
Finally, survey your affiliate marketing audience either through a marketing email or by embedding a survey on your site. Our survey collected ideas for further guides, and the overwhelmingly positive responses justified our effort to promote them on WBUR.org.
Sources of Traffic
Over the course of the experiment, we promoted the site with 104 Facebook ads, 16 banner variations on www.wbur.org, 2 mentions within articles on www.wbur.org, 6 tweets, and 1 marketing email.
We saw the best product click-through-rates for audiences originating from www.wbur.org and from our email list. Paid traffic originating from Facebook was far less likely to click on one of our suggested products – even our most successful Facebook ad could not compete with the results from organic traffic.
| Source of Traffic | Guide Click Rate | Product Click Rate | Aggregate Click Rate | Cost Per Product Click |
|---|---|---|---|---|
| WBUR.org – Header Banners | 3.13% | 5.27% | 0.17% | FREE |
| WBUR.org – Mid-page Banners | 3.35% | 15.23% | 0.51% | FREE |
| WBUR.org – in-article mentions | 0.23% | 0.00% | 0.00% | FREE |
| Twitter – @WBURExtra | 0.19% | 0.00% | 0.00% | FREE |
| Facebook Ads – Overall | 2.95% | 4.26% | 0.13% | $11.92 |
| Facebook Ads – Most Successful Ad | 8.23% | 3.30% | 0.27% | $4.17 |
| *Marketing Email | 16.67% | 100.00% | 16.67% | FREE |
*This marketing email was a low-volume test with only 14 email addresses, but it showed encouraging results.
Successful WBUR.org Affiliate Articles
It has long been WBUR’s practice to use Amazon affiliate links when an editorial article makes reference to a book. These links appear in articles sharing lists of books, i.e. holiday gift guide or summer reading lists, as well as author interviews. This is an exception to the station’s overall guideline against posting affiliate marketing content on WBUR.org.
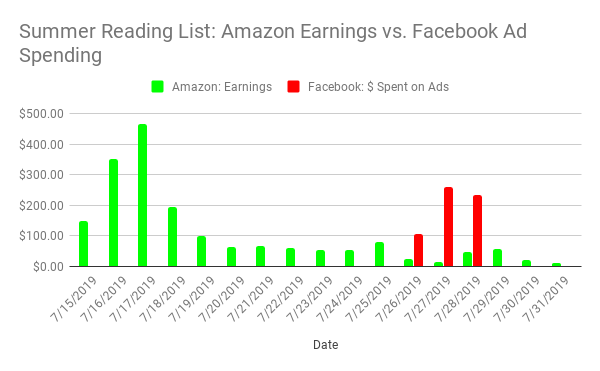
While promoting WBUR Guides, WBUR/NPR’s On Point aired a show focused on summer reading and published a corresponding article with links to purchase the books at Amazon. The summer reading list article yielded over $1,600 in Amazon referral fees, all from organic traffic. Once their organic traffic slackened, we ran a Facebook ad campaign promoting the summer reading list article.
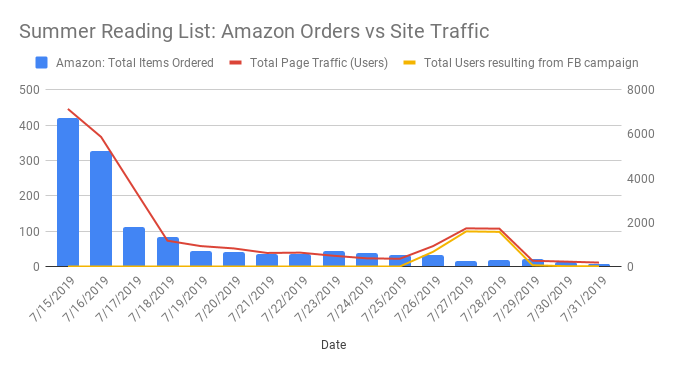
The above chart follows the large number of orders (blue bars) as well as the page traffic for the summer reading list article (red line). The yellow line indicates the portion of that traffic sent from our paid Facebook ads. Our campaign successfully sent users to the article, but the visible gap in the chart between traffic and purchases indicates that users sent by Facebook ads were not as primed to make a purchase. Before our campaign ran, over 5% of the page’s audience made an order, earning $.08 cents per user. During the period of our campaign, that dropped to 1.5% or only $0.02 cents per user.

This chart follows the earnings generated by the article each day (green bars) as well as the amount we invested in Facebook ads each day of our three-day campaign (red bars). Our campaign resulted in a somewhat anemic boost to earnings, and did not recoup the $600 spent on promotion.
Lesson: Organic Traffic is Necessary to Produce a Profit
Your station’s organic web traffic is your most precious resource in Affiliate Marketing; this audience is already engaged with your content, and you’re more likely to hold their interest through to a product click. Work with your editorial team to expose your content to the readers of your news site as much as is possible.
In our case, we couldn’t treat our guides as if they were regular news articles on WBUR.org, but we managed to extract concessions like inserting links to guides into relevant articles as well as promoting the content with banners on WBUR.org.
You should expect push-back from your editorial team. Journalists may have an antipathy towards Affiliate Marketing in principle, as it departs from orthodox journalism standards. Get your foot in the door where you’re allowed and track your results, surveying your audience if possible. If you can demonstrate that your content added value for the reader while earning income, you may have an easier time making your case for further affiliate marketing efforts.
Lesson: Facebook ads will not turn a profit for affiliate marketing
You’ll always pay more for your audience than can wring out of them in referral fees. Consider using it instead as a tool for testing content or to acquire email addresses. Our Facebook ads only worked during the period when they ran. If instead you can get the user’s email address, you may continue to market your affiliate content to them at no cost using an email newsletter.
Writing Style
Over the course of the project, we hired two contributors with distinct voices. We asked our first author, Rebecca Palermo to write product reviews from a personal perspective, while we asked our second author, Rachel Brandt to used a more explanatory style which more closely resembled journalism. We asked them to each write an article about sustainable home goods, then measured our audience’s reaction to each style.
| Writing Style | Product CTR for WBUR Users from Banner Ads | Product CTR for Facebook Users from Paid Ads | Cost per Product Click for Facebook Users |
|---|---|---|---|
| Product reviews from a personal perspective | 1.80% | 7.90% | $10.34 |
| Explanatory style, closer to a journalistic approach | 2.80% | 6.00% | $12.50 |
Our results indicated that users coming from Facebook ads were more engaged with the product review writing-style. Meanwhile, those coming from WBUR.org banner ads appeared to find the explanatory journalism-style content more engaging.
Lesson: Test Different Writing Styles
Try different writing styles to see what is most effective at connecting with your users. Keep in mind that different acquisition methods may affect which content is most-appreciated by your users.
In our case, our realization of the value of WBUR’s organic audience means that we’d stick with a writing style that looks and feels more like journalism, as it appears to capture the attention of that audience more effectively.
Our next blog post in this series on affiliate marketing will cover future prospects for affiliate marketing within media organizations.
If you haven’t already, check out our previous posts in this series on The Challenge and The Strategy
If you have any questions about this experiment, or if you’re planning affiliate marketing content, please feel free to contact me at tbfuller@bu.edu or on Twitter at @ted_fuller