This is the second post of a three part series about BizLab’s work with WBUR CitySpace. This post is about the survey we used to collect feedback about events and understand audience motivations. If your station wants to start surveying your audiences at events or if you want to learn more about survey design, this post is for you!
[I’m Sarah Barden, a BizLab Summer Fellow investigating revenue streams for WBUR CitySpace. I just graduated from a dual degree program between Wellesley College and Olin College studying mathematics, engineering, and user experience design, and I’ve started a Master’s in Engineering Management at Dartmouth this fall.]
Goals of the Feedback Survey
Our learning goals for the survey were:
- Get general feedback on events, both quantitative and qualitative
- Understand what brings people to events
- Understand how people hear about our events
- Audience demographics
This information reveal opportunities for new revenue. By combining these learnings with existing data about ticketing, attendance, and marketing efforts, we will be able to determine how our current pricing relates to value delivered.
Survey Design
I used SurveyMonkey to create a 14-question survey to be conducted after events in CitySpace and distributed through post-show emails. We collected 164 responses in total, from 9 events. The survey questions were:
- Which event did you attend at WBUR CitySpace?
- Overall, how well did the event meet your expectations?
- How would you rate the following aspects of the event? Speaker/Performer(s), Host/Moderator(s), Length of event, Facilities, Audience Q&A, Concessions
- Would you recommend a WBUR CitySpace event to a friend? Why or why not?
- CitySpace is run by WBUR (Boston’s NPR News Station). Had you heard of WBUR before today?
- When deciding whether or not to attend this event, how important were the following? Topic, Speaker/Performer(s), Location at CitySpace, Date and Time, Price of Event.
- How did you hear about this event?
- How did you primarily get to this event?
- We are considering creating a CitySpace membership. What perks would you like to see in CitySpace events membership?
- What age range do you fall into?
- Which of the following categories best describes you?
- What gender do you identify as?
- Which race/ethnicity best describes you?
- If you would like to receive the WBUR CitySpace newsletter, please share your email here.
Response Collection In-Person vs. Email
Announcements were made at the beginning and end of the events asking people to complete the survey because this feedback would help us improve future events. After the event, we collected responses in the CitySpace lobby with one or two people asking attendees leaving the venue to fill out a short survey. We had one or two laptops, a tablet, or a link to fill out on a phone. The second collection method was a link to the survey in the post-show email, asking attendees to offer their feedback.
Overall, we found that the in-person ask after the event generated more responses than the post-show email, but only if we were actively asking individuals for responses as they left and if we had enough devices to make the wait time as short as possible. The in-person ask was time and labor intensive, however, so if your team needs a simple survey solution, the post-show email ask can still bring in some responses.
Significant Survey Results
Overall, we had positive responses to our general feedback questions. 73% of survey respondents said the event they attended was “Better than expected” or “Much better than expected”, and each specific aspect (Speaker/Performer, Host/Moderator, Length of event, Facilities, Audience Q&A, Concessions) was rated 4.4 or higher out of 5.0, except for Concessions, which was rated 3.8.
The following charts are some of the more surprising or significant results of the survey beyond general feedback.
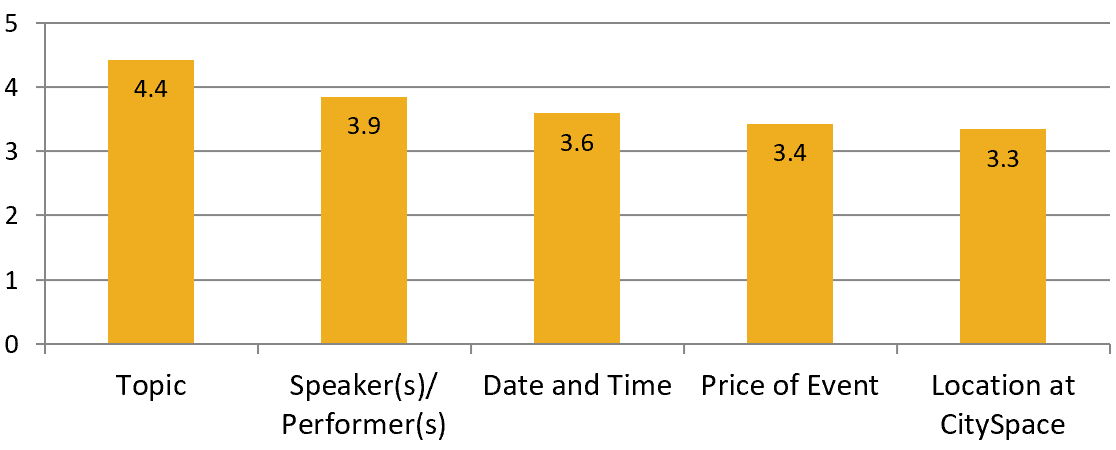
People attend CitySpace events for the topic, not the location or price.
We asked “In deciding whether or not to attend this event, how important were the following?” and respondents rated each aspect on a 5-point scale “Extremely important, Very important, Somewhat important, Slightly important, Not at all important”.
The chart below shows that topic is the most influential factor for these survey respondents. Regardless of specific speakers, location, date/time, or price, people are coming for the topic of the event. The least important influences were location and price. For location, people would be willing to see this event somewhere else, but we can not change the location of CitySpace. Because the price was also rated low in importance, we now know that people would be willing to pay more for topics they love.
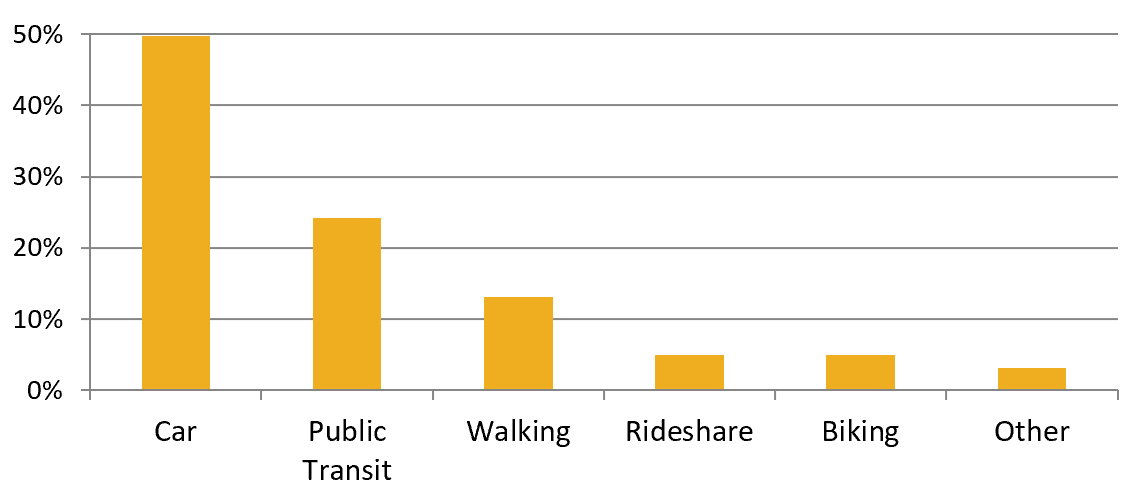
Most people come by car to CitySpace events
We have heard anecdotally that transportation is a barrier to attending CitySpace events. Driving a car in rush hour traffic and then finding parking near CitySpace can be difficult, but CitySpace is about 50 feet from a public transit train stop in Boston. Given this, we were surprised that about 50% of attendees reported traveling by car to our events. This may be due to the timing of events in the evening: if most people are driving a car to work, attending a 6pm event likely means they drive directly from work. For those taking public transit, the commute could be up to an hour for those coming from outside the immediate area. To bring new audiences to CitySpace, beyond the neighboring areas, we are now considering offering Lyft or Uber codes, or similar, to support those interested in the event but unable to commute to the location.
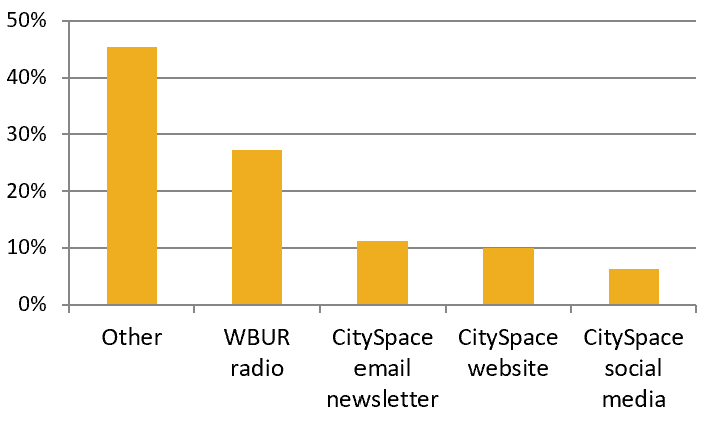
People hear about CitySpace events in “Other” ways
We thought CitySpace’s email newsletter, website, and social media efforts were bringing in our audience. But almost 50% of survey respondents answered “Other” when responding to the question “How did you hear about this event?” This was very surprising to the CitySpace team! The free-form responses to “Other” mentioned friends, family and directly from the speakers.
These responses are informing our marketing efforts. There may be ways to increase ticket sales through certain marketing channels, or use marketing efforts to offer discounts or special offers as ways to get more emails and more audience.
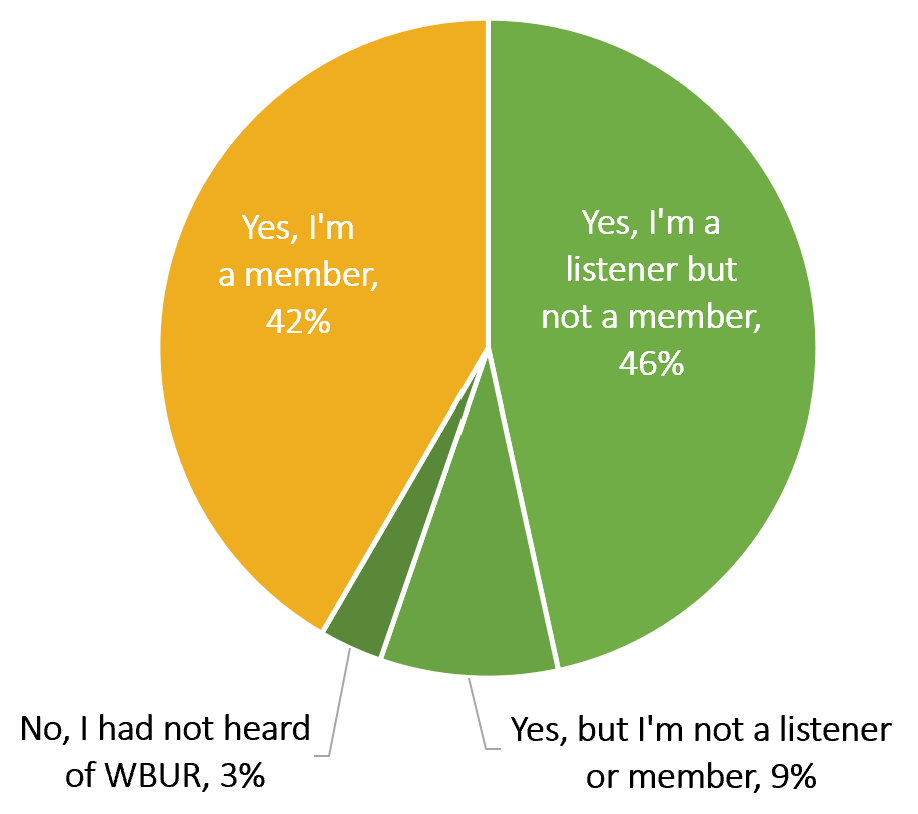
Most of the CitySpace audience are WBUR listeners, but not all are donors.
If you read the first post in this series, I shared this data in learning about CitySpace’s audience. When asked “Had you heard of WBUR before today?” 42% said “Yes, I’m a member” and 46% said “Yes, I’m a listener but not a member.” A listener who is not a member (donor) is a potential donor. We hope to convert these attendees into WBUR donors by offering more engaging programming, and inspiring them to donate.
The CitySpace team had thought attendees would be listeners, so were surprised that 12% of survey respondents were either not listeners or had not even heard of WBUR before attending an event.
Edit your survey to only collect useful data, but keep it similar!
After a successful run of the summer survey, we reviewed these results and decided to continue surveying our audience, but to make changes to the survey. We removed the questions that we felt we had found the answer to and adjusted questions we thought could be simplified.
We simplified some of the longer questions where respondents had to rate many aspects of the events on a relative scale. We also adjusted certain parts of the survey to be more specific, for example, the questions about ticket price. Overall, however, we kept the survey as similar as possible so that we could compare the results over time.
Summary
- In terms of what influences people to come to events, we found that the event’s topic on average was the most influential, followed by speaker/performer. In looking at specific events, such as a comedian or a podcast, speaker/performer outranks topic because the audience wanted to see that specific person.
- Since price was in the bottom two for important factors influencing attendees, we can infer that price is less important, and therefore people may be willing to pay more for people or topics they really want to hear. This matches up with some survey comments that mention CitySpace prices as being “reasonable.”
- Half of event attendees learn about CitySpace events outside of CitySpace’s direct outreach, instead through word of mouth, and other social media. The CitySpace team can use this insight to change their strategy on CitySpace social media marketing and also take advantage of these other forms of marketing in order to increase ticket sales and awareness.
- With so many listeners attending CitySpace events who are not yet donors, we believe this is a prime opportunity for donation asks at events, when buying tickets, or through email asks. The next post will dive more into how we tested asking for donations.
Overall, if your team has the ability to collect data through a post-event survey, think carefully about the questions you ask, and know that you can try the survey for a few weeks and then edit the questions as needed, though keeping it similar enough to compare results over time. This data on events not only helps improve general event structure, but with asking questions about people’s motivations for attending events and how they feel about price, you can gain insight into how flexible your audience is on prices and what they value most about the venue.